How Tom's Guide Tests and Reviews TVs
From color accuracy and contrast to gamma and overall image quality, here's how we evaluate TVs using objective tests and subjective comparisons.
They say beauty is in the eye of the beholder, but when you read a TV review, you want to know that the evaluation you're reading will reflect your own experiences, and isn't overly influenced by the eyes and ears of the reviewer. Here at Tom's Guide, we work hard to make sure our TV reviews are objective and accurate, whether we're looking at one of the best TVs on the market, or one of many cheap TVs out there.
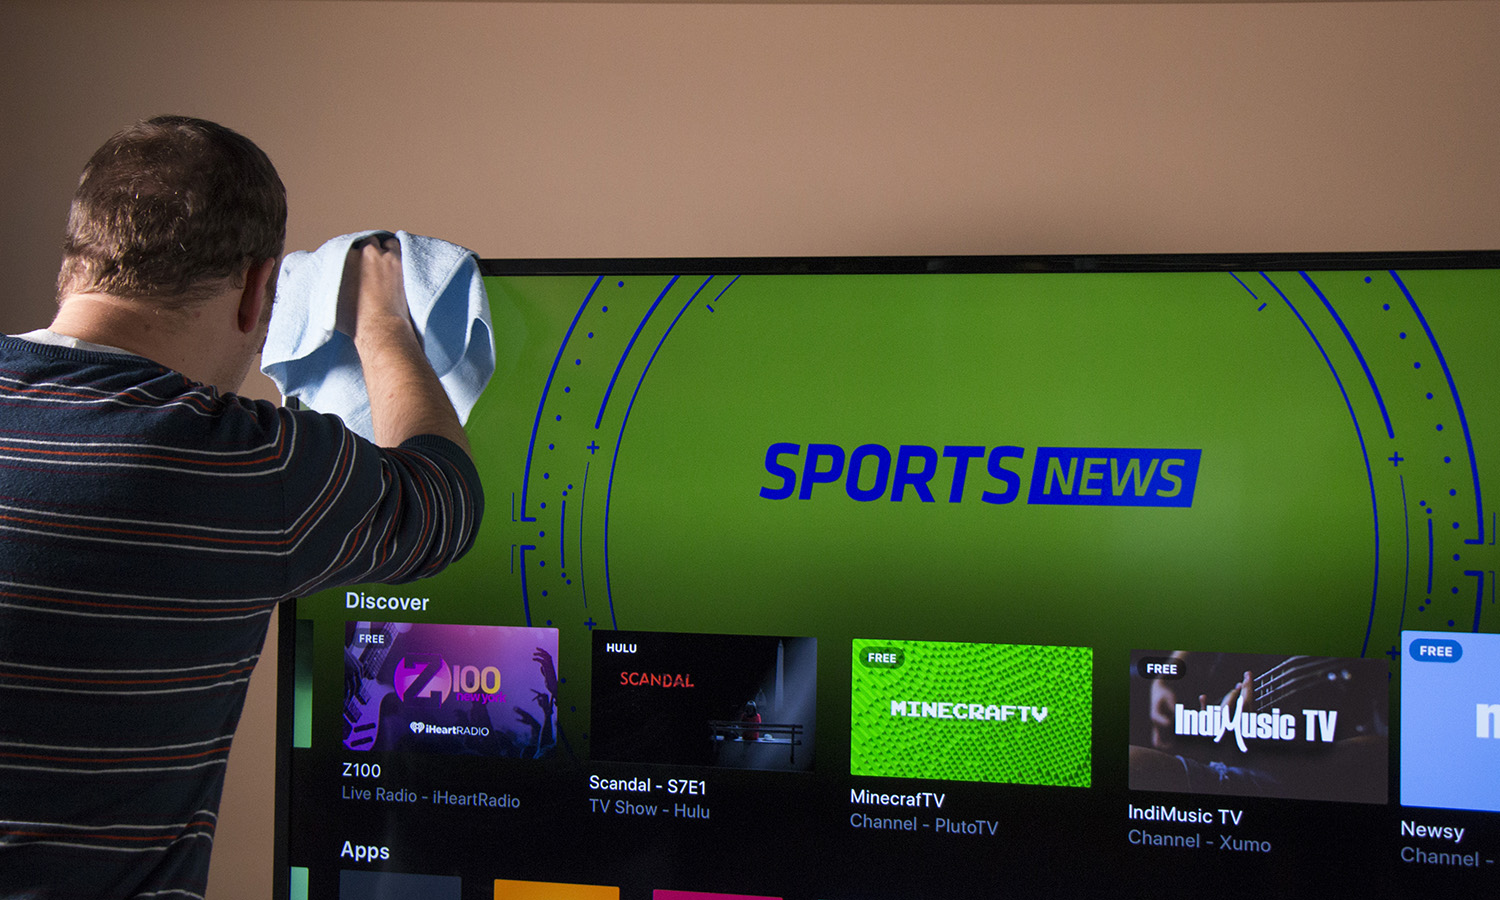
That's why we put each television we review through a series of instrument tests to measure different aspects of performance, like color accuracy, brightness, and more. We use the results as an objective measure to supplement our reviewers' subjective impressions of color, contrast and detail in the tests with real-world content.
Instrument Tests and Equipment
Our head of testing, who is an Imaging Science Foundation Level III certified TV calibrator, performs all our objective TV testing in a dedicated test space in Ogden, Utah, using an array of specialized equipment designed specifically for the purpose.
For our measurements, we use two high-end devices. We take the measurements using a Klein K10-A colorimeter, one of the fastest and most color-accurate meters on the market, which has been profiled with a Jeti spectraval 1501-HiRes spectroradiometer capable of measuring luminance values up to 140,000 candelas per square meter (cd/m2, colloquially referred to as nits) and spectral wavelengths as narrow as 2nm. The combination of these devices allows us to maximize capability and speed across the widest range of display types. We calibrate both meters annually to ensure accuracy.
The third key component of our testing is our Murideo 8K SIX-G pattern generator. This creates the HDMI-native images (or patterns) we measure with the meters, and contains a number of other patterns oriented toward geometry or skin tone that allow us to dive deeper into other aspects of the TV’s performance when necessary.
We analyze this data using Portrait Displays’s professional calibration software, Calman Ultimate. Using a combination of custom and prefabricated workflows, we test performance in multiple display modes, though we typically only report the results from the “best” mode available on the set. (This is usually Filmmaker Mode, which is designed to recreate the theater experience as much as possible, but may be something else if that mode is not available.)
Finally, we use a Leo Bodnar 4K HDMI Video Signal Lag Tester to test video signal delay, or the time (in milliseconds) it takes for the signal to travel from the video input until it displays on-screen. We perform this test in Game mode whenever it is available; this reduces the amount of image processing the TV performs to offer a faster response time and reduce the gap between an action in-game and the resulting image on-screen. Although this particular data point will matter little to those who only watch movies or live TV, the milliseconds of lag between signal and display do make a difference when gaming. The device measures combined input lag and pixel response time, but we don't differentiate between the two in our evaluations. In general, we consider any result below 20ms good and any result below 10ms excellent.
Get instant access to breaking news, the hottest reviews, great deals and helpful tips.
TV performance tests
Here are the main measurements we use to objectively evaluate TV performance.
Color Accuracy and Gamut
TV technology may improve with each new generation of sets, but TVs are still unable to produce every color the human eye can see. A gamut represents a certain subset of all available colors, and we consider three of them when evaluating TVs.
Rec.709 is the gamut representing the color set of the standard dynamic range (SDR). DCI-P3 is the first of two high dynamic range (HDR) gamuts we observe; DCI-P3 contains significantly more colors than Rec. 709, albeit with a deeper red primary and a greener green primary. (We measure a minor variation called UHDA-P3, which is identical to DCI-P3 except for a slightly redder red primary.) Rec. 2020 is by far the widest of the gamuts, but also the one that the fewest TVs on the market can most accurately recreate. We report what percentage of each gamut the TV covers; this number may sometimes exceed 100% (when, for example, measuring an OLED’s capability with Rec. 709).
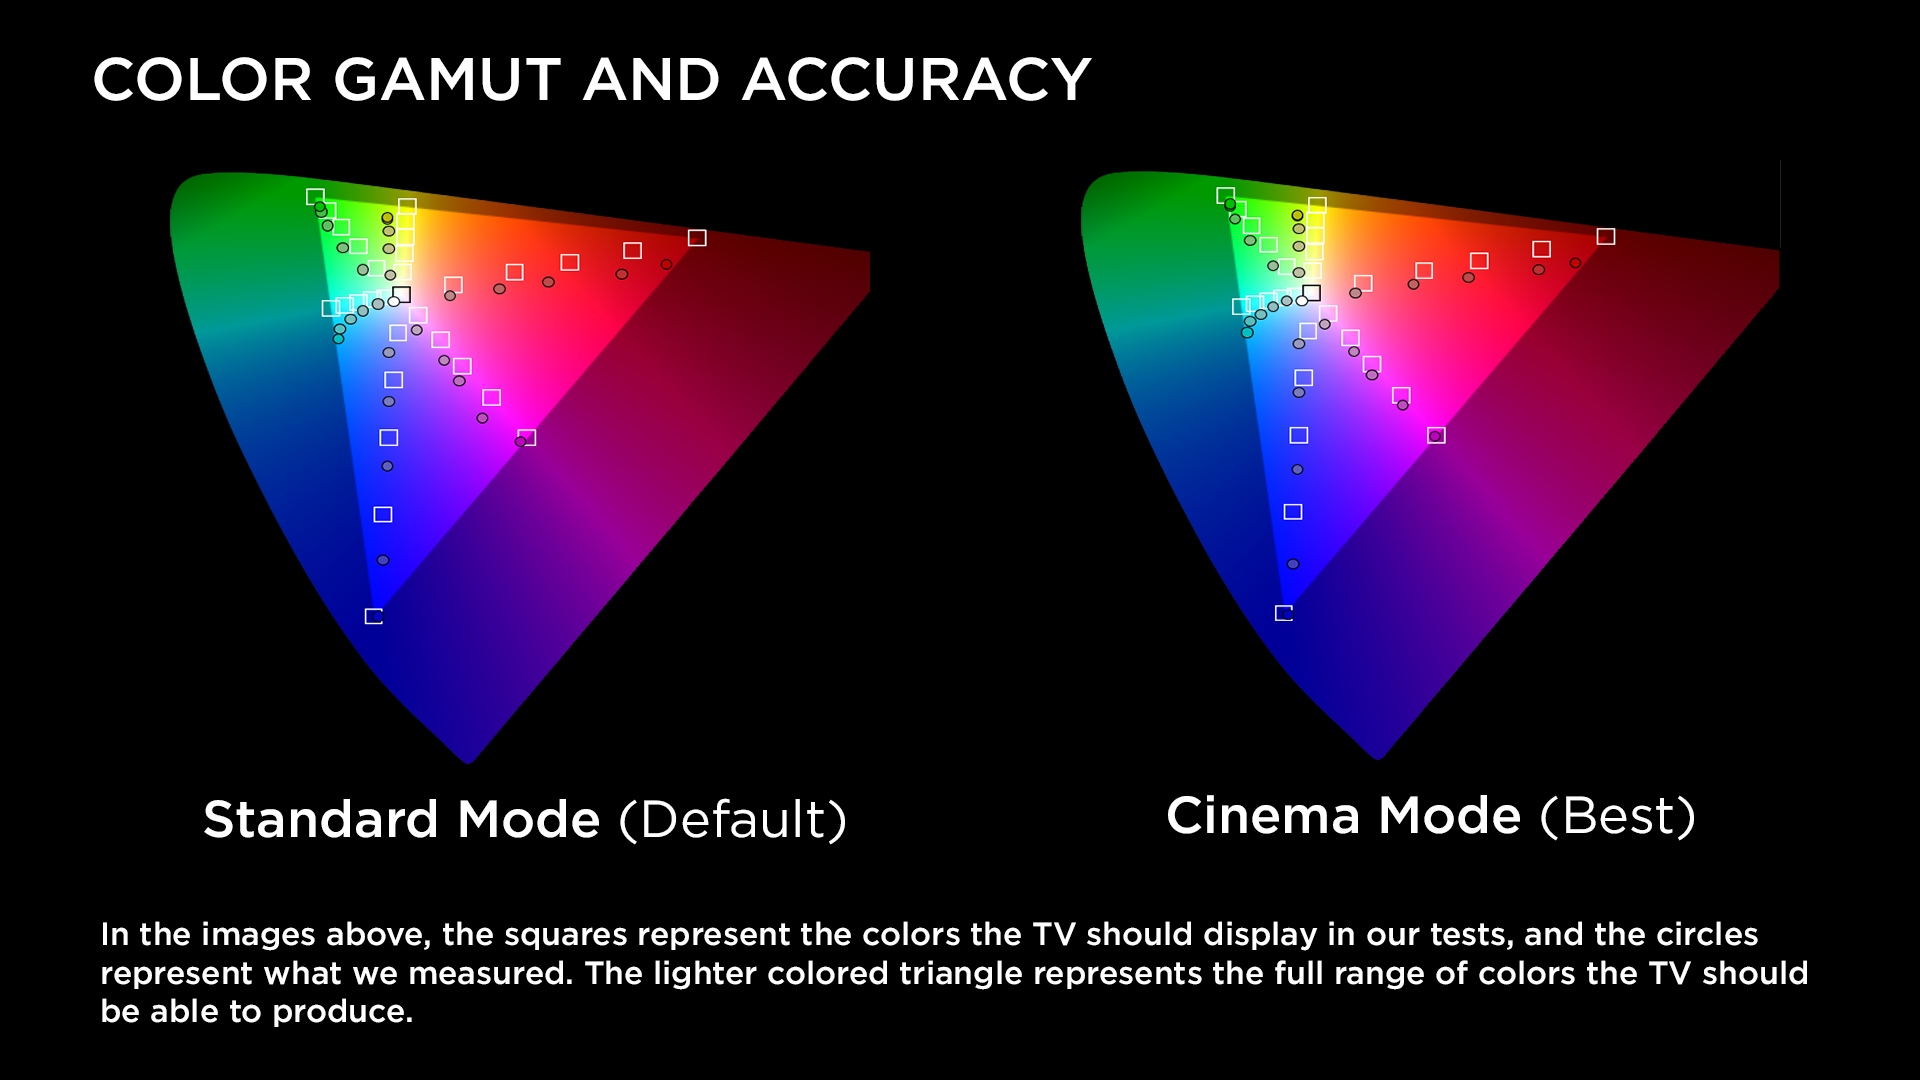
We compare colors in these gamuts to what the TVs we're testing can reproduce. This means measuring test patterns on the TV that use all three primary colors (red, green and blue) and all three secondary colors (cyan, magenta and yellow), as well as dozens of additional, lighter shades. From this information, we can determine, for example, if a color that should be a medium magenta is a bit purple, or if a light yellow is too orange.
The number we use to report color accuracy is the Delta-E, a mathematical representation of the difference between color at the source and what is displayed on the screen. Lower Delta-E values are always better, with the best sets on the market getting below a value of 2.
In the chart above, the light triangle represents the target gamut for the type of TV we are reviewing (in this case, Rec. 709). The squares represent the colors of the test patterns we send to the TV, and the dots represent the color the TV actually displayed.
Brightness and Contrast

While our reviews frequently refer to both brightness and contrast, the more accurate terms would be peak brightness and black level.
The actual levels of light put out by a TV — either by an LED backlight or the display panel itself, in the case of OLED displays — play an enormous role in how vibrant colors look, and higher brightness levels translate into whiter whites and colors that pop. We measure each picture mode’s maximum brightness using a perfectly white test pattern covering 10% of the TV’s screen and measure the luminance. We report this in nits.
Black level is the flip side of peak brightness, and directly impacts the sharpness of the display. Traditionally, contrast is presented as a ratio of the brightness measured on the brightest and darkest colors the display can produce, namely white and black. Brighter whites are a direct result of overall brightness, while darker blacks are the result of reducing that backlight to its lowest levels.
Traditionally, contrast levels are determined by calculating the difference between the brightest and darkest measurements (with higher numbers better here). Unfortunately, manufacturers have rendered this specification almost meaningless. There is no standardized measurement test for contrast, so the number listed in a TV's specifications can rarely be taken at face value. Additionally, technologies like OLED (which turn off pixels entirely, and thus technically have infinite contrast) and local dimming have made it more difficult to gather objective data on contrast levels that reflects the actual viewing experience. We still test for contrast levels and discuss this data in reviews as needed, but we generally relegate discussion of contrast to our subjective evaluation.
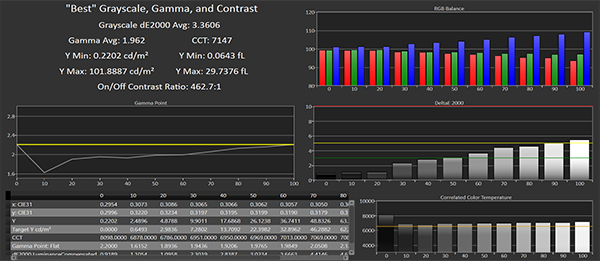
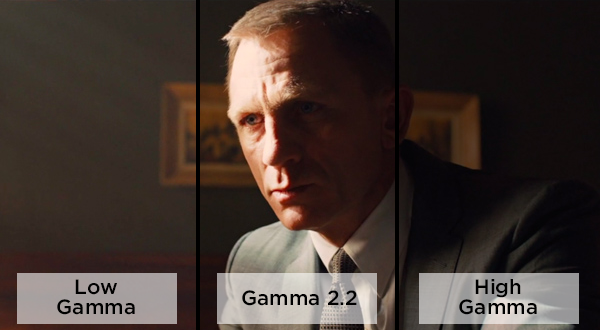
Gamma vs. Contrast
Once we’ve completed the instrumental testing, our reviewer spends time with each TV using it the way you would, so that we may complement the hard data we collected with real-world experience. This always involves standalone viewing in a simulated living room, and may also include side-by-side comparisons with similar TVs.
Our reviewer watches a variety of content, using several content sources and media formats. These range from newly released movies on 4K UHD Blu-ray to digital files on USB and upscaled 1080p content from standard Blu-ray discs.
The exact library of content varies from reviewer to reviewer, but common titles include recent Hollywood hits spanning a number of genres, such as Avatar: The Way of Water, Barbie, Dune 2, Oppenheimer, and Spider-Man: Across the Spider-Verse, as well as TV and streaming series and sports.
We watch live over-the-air channels and stream video from several apps and services, such as YouTube and Netflix. Throughout our viewing, we look at everything from color quality and on-screen detail to upscaling of lower resolution content and backlight quality.
We know it's easy to get lost in jargon and specifications when comparing TVs, so we aim to present this information in a way that's useful and informed, without digging too deeply into the more granular aspects of our testing processes. In all of our reviews, we strive to combine hard data with our viewing evaluation to present a clear explanation of a given TV's performance and viewing experience. The result should be a clear discussion of how well a given set looks, sounds and compares to other TVs on the market.
Subjective Evaluation by Reviewer
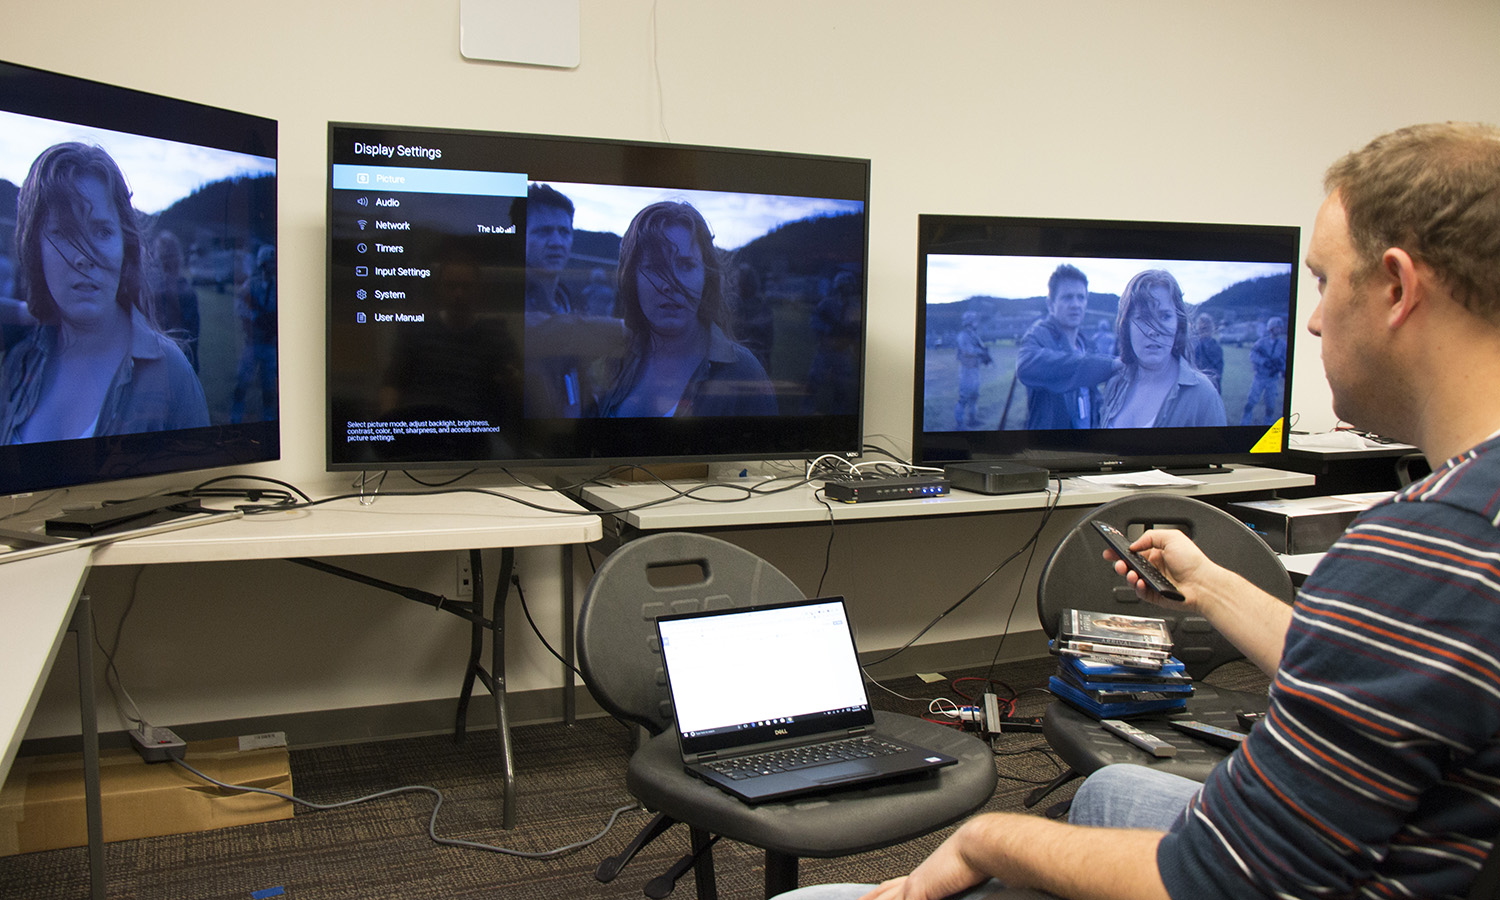
Once we’ve completed the instrumental testing, our reviewer spends time with each TV using it the way you would, so that we may complement the hard data we collected with real-world experience. This always involves standalone viewing in a simulated living room, and may also include side-by-side comparisons with similar TVs.
Our reviewer watches a variety of content, using several content sources and media formats. These range from newly released movies on 4K UHD Blu-ray to digital files on USB and upscaled 1080p content from standard Blu-ray discs.
The exact library of content varies from reviewer to reviewer, but common titles include recent Hollywood hits spanning a number of genres, such as Avatar: The Way of Water, Barbie, Dune 2, Oppenheimer, and Spider-Man: Across the Spider-Verse, as well as TV and streaming series and sports.
We watch live over-the-air channels and stream video from several apps and services, such as YouTube and Netflix. Throughout our viewing, we look at everything from color quality and on-screen detail to upscaling of lower resolution content and backlight quality.
We know it's easy to get lost in jargon and specifications when comparing TVs, so we aim to present this information in a way that's useful and informed, without digging too deeply into the more granular aspects of our testing processes. In all of our reviews, we strive to combine hard data with our viewing evaluation to present a clear explanation of a given TV's performance and viewing experience. The result should be a clear discussion of how well a given set looks, sounds and compares to other TVs on the market.
More from Tom's Guide

Tom's Guide upgrades your life by helping you decide what products to buy, finding the best deals and showing you how to get the most out of them and solving problems as they arise. Tom's Guide is here to help you accomplish your goals, find great products without the hassle, get the best deals, discover things others don’t want you to know and save time when problems arise. Visit the About Tom's Guide page for more information and to find out how we test products.
-
Like may professionals I use LightSpace CMS for all display verification and calibration.Reply
It is the most common display calibration system in use in the professional (Film and TV) industry.
There is also a free 'verification' version that can be used to check any display.
 Club Benefits


